When it comes to data science, raw data seldom comes in a format that is easy to use. Raw data will often contain inconsistencies or have missing values and be structured in a way that is difficult to analyze. Consequently, you will have to employ some thought process about data manipulation, which effectively means cleaning up and converting your data into a format that you can use.
One of the best tools for data manipulation is Pandas DataFrame in Python because it is a powerful data structure that makes handling, exploring, and reshaping datasets very easy.
In this blog, we will work through the basics of getting started with Pandas, explore the powerful features of the library, and discuss why Pandas has become a must-have for anyone wanting to work with data science and sharpen their programming skills.
Creating and Exploring a Pandas DataFrame
Any data modification task begins with the creation or import of a DataFrame. Lists, dictionaries, and reading external files like Excel or CSV can all be used for this.
Setting Up Pandas
Make sure Pandas is installed before you begin. In your environment, run this command:

Source: https://www.geeksforgeeks.org/pandas/data-manipulattion-in-python-using-pandas/
After installation, import pandas as pd can be used to incorporate it into your project.
Building Your First DataFrame
Pandas’ essential component is the DataFrame. Imagine it as a two-dimensional table with rows and columns labelled.
Example:

Source: https://www.geeksforgeeks.org/pandas/data-manipulattion-in-python-using-pandas/
Analyze how Pandas assigns numeric row indices [0, 1, 2, 3] automatically. Although these can be altered, the default is generally effective.
Expanding the DataFrame
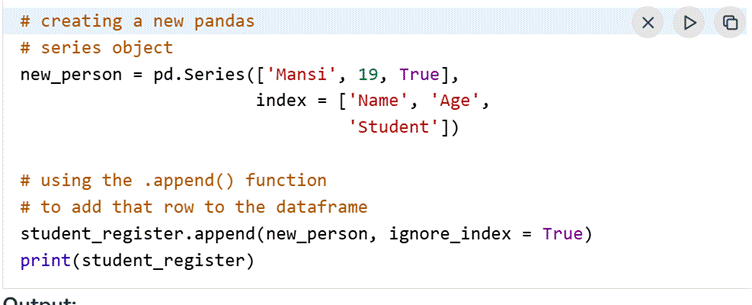
The .append() method allows you to add more rows. In essence, every row in a DataFrame is a Series object.

Source: https://www.geeksforgeeks.org/pandas/data-manipulattion-in-python-using-pandas/

Source: https://www.geeksforgeeks.org/pandas/data-manipulattion-in-python-using-pandas/
Now your data frame includes a new record.
Exploring Dataset Properties
Pandas offers convenient ways for larger tables to verify structure.

.shape → Dimensions of the dataset (rows × columns)
.info() → Column names, types, and memory usage.
.corr() → Correlation between numerical columns.
Source: https://www.geeksforgeeks.org/pandas/data-manipulattion-in-python-using-pandas/
Output is:
Source: https://www.geeksforgeeks.org/pandas/data-manipulattion-in-python-using-pandas/
As you can see above, the .shape function is used for the created dataframe, which gave the following output: (4, 3). The output of .info() tells us the meaning of this information:
- RangeIndex describes the index column, or [0, 1, 2, 3] in our datagram. How many entries (or rows) are there in the dataframe?
- Data columns, as the title states, describe the number of columns.
- Name, Age, and Student are the names of the columns in our datagram.
- “Non-null” means that there is no value in that particular column as NA/NaN/None. Object, int64, and bool are the datatypes of each column.
- dtype tells us how many unique datatypes are in our datagram, as well as how it makes the data cleaning process simple.
Moreover, in modern-day machine learning models, memory usage is key; you can’t ignore it.
Quick Statistical Summary
To get a general summary of numerical features with the .describe() function:
Print (student_register.describe())
This will provide:
- Count of the entries
- Mean and standard deviation
- Minimum, maximum, and quartiles
These summaries can help identify outliers or data distribution
Removing Unnecessary Columns
You can remove a column if it isn’t required for analysis:

Output: the age column is removed:
Source: https://www.geeksforgeeks.org/pandas/data-manipulattion-in-python-using-pandas/
Deleting Rows
In the same way, rows can be eliminated by index, which is especially helpful for getting rid of duplicates or invalid data.

Source: https://www.geeksforgeeks.org/pandas/data-manipulattion-in-python-using-pandas/
Handling Missing Data
Real-life datasets will frequently have NaN (Not a Number) values. Fortunately, Pandas provides many ways to deal with those missing values:
- Remove missing data using: df.dropna()
- Drop columns with NaN using: df.dropna(axis=1)
- Fill values respectively using df.fillna(value=0) or with a statistical approach with the mean/median
Cleaning a dataset with missing values ensures that the dataset is consistent before going into the analysis.
Sorting and Filtering
Pandas enables sorts with .sort_values() or .sort_index(). It also enables you to filter your datasets based on conditional values: students[students[‘Age’] > 18] will return you just those rows where Age is greater than 18.
This means you can sort the data and then filter it, making the analysis of parts of the data very manageable.
Why Pandas is a Must for Data Science
Data manipulation is the cornerstone of any data science workflow. Without clean, tidy data, even the most complex models and algorithms will have issues.
Pandas is critical because they:
- Enhances the cleaning process of repetitive tasks.
- Has SQL-like operations that require very little coding.
- Works well with NumPy, Matplotlib, and Scikit-learn.
- It is highly utilized in data science certifications and industry projects.
Conclusion
Data manipulation is the core of data analysis. Python users who handle Pandas can comfortably manipulate data, from filtering to reshaping, in various formats. The DataFrame format and flexibility that Pandas provides streamline data wrangling and allow users to perform tasks that would otherwise require cumbersome lines of code.
If you are a new data analyst looking to advance in the data science field, mastering the fundamentals of Pandas as a data manipulation tool is essential. By learning and understanding the techniques established in this textbook, you will have the foundational tools to prepare, clean, and transform datasets before meaningful data analysis or predictive modeling.


Leave a Reply