Evening Star Pattern: A Simple Guide For Everyday Traders
Have you ever looked at a stock chart and wished it could just “tell” you when the uptrend is about to end? The evening star candlestick pattern is one of those signals that quietly whispers, “The party might be over; it’s time to be careful.” Think of it like the sky at sunset: when bright daylight slowly fades and darkness sets in, you know night is coming; similarly, this pattern marks the transition from bullish optimism to bearish caution.
Learn the evening star pattern, evening star candlestick pattern, and how the best stock market course in India can help you trade reversals confidently.
Introduction to Evening Star Pattern
The evening star pattern is a classic technical analysis signal used in stocks, forex, and indices to highlight a potential reversal from an uptrend to a downtrend. It is widely taught in professional trading modules and is considered more reliable when it appears after a strong, clearly visible upward move.
For the general public, this pattern offers a simple way to understand when buying enthusiasm might be cooling off, even if fundamental news still looks positive. That is why the evening star candlestick pattern is a favorite topic in many trading guides and learning communities.
Structure of the Evening Star Candlestick Pattern
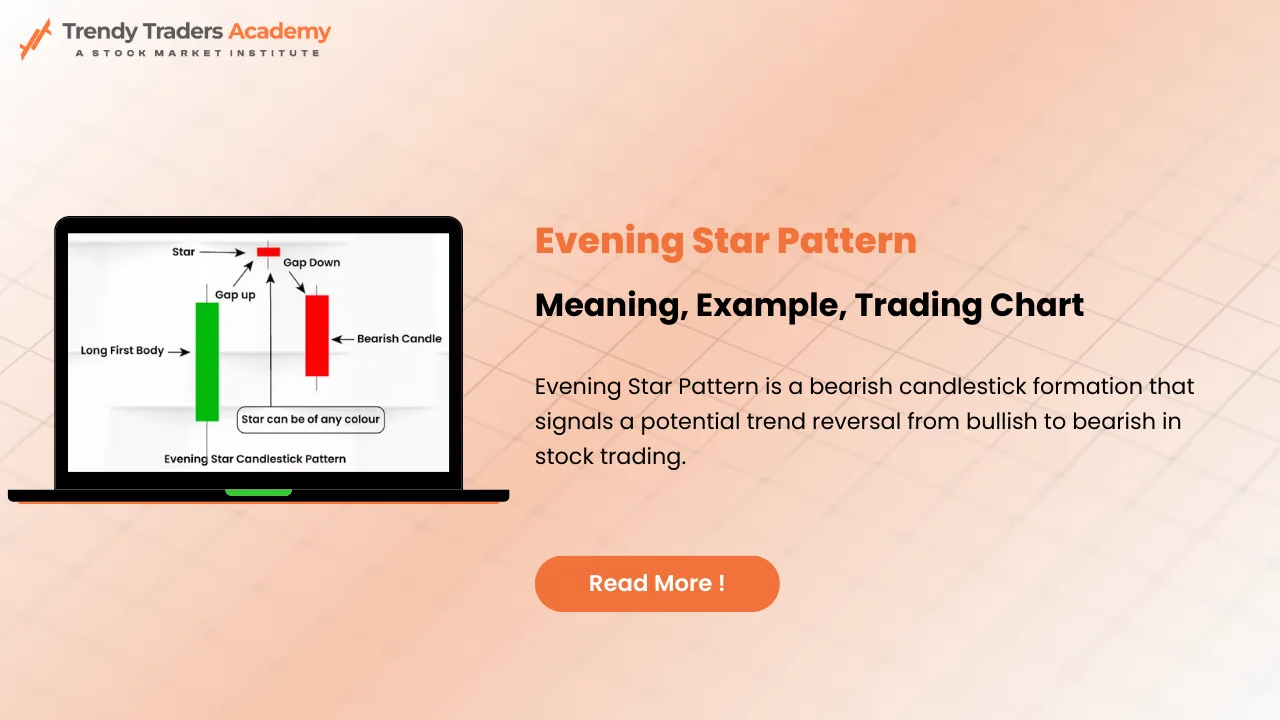
The evening star candlestick pattern is built from three candles that together tell a story. Understanding each candle helps you see how market sentiment shifts step by step.
- First candle: Strong bullish candle
The first candle is usually a large green (bullish) body, showing that buyers are fully in control and the uptrend is still strong. - Second candle: Small-bodied “star” with a gap
The second candle is a small-bodied candle (can be bullish, bearish, or a doji) that gaps up from the first candle’s close, indicating hesitation and indecision. - Third candle: Strong bearish candle closing deep into first candle
The third candle is a long red (bearish) candle that opens lower (often gap down) and closes well into the body of the first candle, confirming that sellers have taken control.
When these three candles appear together at the top of an uptrend, traders call it an evening star pattern.
Psychology Behind the Pattern
Behind every candlestick pattern is human psychology: fear, greed, hope, and doubt. The evening star is basically a mood swing on the chart, from confidence to confusion to concern.
- In the first candle, buyers are enthusiastic and push prices higher, often helped by positive news or strong momentum.
- In the second candle, the market pauses; the small body suggests neither side is fully in charge, and the gap up shows leftover optimism that quickly fades.
- In the third candle, sellers rush in, and earlier buyers start booking profits or exiting weak positions, causing a sharp move down.
This emotional shift from optimism to fear is exactly what makes the evening star pattern a bearish reversal signal.
How to Identify an Evening Star on Charts
Spotting the evening star pattern becomes easy once you know what to look for, even on free charting platforms.
Key identification rules:
- There must be a prior uptrend, ideally with clear higher highs and higher lows.
- A large bullish candle appears, followed by a gap-up small candle (the star) that reflects uncertainty.
- The third candle is a strong bearish candle that closes at least halfway into the body of the first candle, sometimes more.
Traders also confirm the evening star candlestick pattern by checking whether the third candle shows strong volume or forms near a known resistance area.
Real-World Examples of Evening Star Patterns
In practice, evening star patterns appear on daily, weekly, and even intraday charts of popular stocks and indices. You will often find them near previous swing highs or just after a stock has rallied sharply without much correction.
Educational portals and broker academies commonly use historical charts to show how the evening star pattern marked the end of rallies in benchmark indices and sectoral stocks. These case studies help beginners connect textbook patterns with real market behavior in India and global markets.
Trading Strategy Using Evening Star Pattern
A basic trading strategy using the evening star pattern focuses on entering short or exiting long positions once the pattern is confirmed.
Typical trading steps:
- Wait for the third candle to close, confirming the pattern and avoiding premature entries.
- Consider entering a short trade near the close of the third candle or on the next candle, especially if the pattern forms near resistance.
- Place a stop-loss above the high of the star or above the pattern’s high, giving some breathing room against market noise.
Many traders also target previous support zones or Fibonacci retracement levels as possible profit targets after an evening star pattern.
Common Mistakes Traders Make
Beginners often misuse the evening star pattern by ignoring context and over-trusting a single signal.
- Trading without a clear prior uptrend
When the pattern appears in a sideways or choppy market, its reliability drops significantly. - Not waiting for confirmation
Jumping in before the third candle closes can lead to false signals if the market suddenly reverses back up. - Ignoring risk management
Some traders treat the evening star candlestick pattern as “foolproof,” but no pattern works 100% of the time, especially during news-heavy sessions.
Understanding these mistakes is as important as learning the pattern itself, especially for the general public who are still learning market basics.
Evening Star vs Morning Star Pattern
The evening star has a bullish twin called the morning star pattern. Both are three-candle reversal patterns, but they appear at opposite ends of a trend.
- The evening star appears at the top of an uptrend and suggests a shift from bullish to bearish control.
- The morning star appears at the bottom of a downtrend and signals a move from bearish to bullish sentiment.
Both patterns help traders plan reversal trades, but the direction and context of use differ completely.
Combining Evening Star Pattern With Indicators
To improve accuracy, many traders combine the evening star pattern with technical indicators and support–resistance analysis.
Popular confirmation tools include:
- Moving averages to check whether price is reversing near a long-term resistance line or above extended levels.
- RSI or stochastic oscillators to see if the market is overbought when the evening star forms, strengthening the bearish case.
- Volume analysis to measure the strength of sellers on the third candle.
By blending candlestick reading with these indicators, traders reduce the chances of acting on weak or random formations.
Timeframes and Markets Where It Works Best
The evening star pattern is visible across multiple timeframes and asset classes. However, its reliability changes based on where and how it is used.
- On daily and weekly charts, the pattern often carries more weight because it reflects broader market participation.
- On intraday charts like 15-minute or hourly, it can still work, but traders must be more cautious about noise and sudden news events.
The pattern is widely used in equity markets, indices, forex pairs, and even commodities, making it a versatile tool for different types of traders.
Risk Management While Trading Evening Star
No matter how strong an evening star looks, risk management remains non-negotiable. A well-defined plan helps protect capital when the market behaves unexpectedly.
- Use logical stop-losses just above the pattern high or above a nearby resistance zone.
- Avoid oversizing positions, especially if you are new or trading leveraged products.
- Set realistic profit targets based on previous support levels, chart patterns, or risk–reward ratios.
Good traders treat the evening star candlestick pattern as a tool, not a guarantee, and always plan for what could go wrong.
How Beginners Can Practice Safely
For the general public just entering the markets, practicing the evening star pattern in a controlled way is crucial.
- Start with paper trading or demo accounts, marking evening star patterns on historical charts and noting the outcome.
- Keep a trading journal capturing screenshots, entry/exit levels, and what went right or wrong.
- Focus on quality setups where the pattern appears after a clear trend and near major levels, rather than every small three-candle formation.
This habit not only builds pattern recognition but also boosts confidence before real money is used.
Why Formal Education Matters in Trading
While it is possible to self-learn from free resources, structured education significantly speeds up your understanding of candlestick patterns and risk management. Formal courses often include real case studies, live market sessions, and mentorship, which are difficult to replicate through random videos alone.
Institutions in India now offer specialized modules dedicated to technical analysis and candlestick trading, where patterns like the evening star are taught in depth. This helps ordinary investors avoid common traps and rely less on tips or guesswork.
Choosing the Best Stock Market Course in India
If you are serious about mastering patterns like the evening star, enrolling in the best stock market course in India for your needs can be a smart move. Different learners require different formats: some prefer classroom batches, others choose online self-paced modules or hybrid programs.
Highly regarded options often include:
- Courses backed by Indian market institutions or exchanges, offering recognized certifications and strong fundamentals.
- Practical technical analysis and trading programs that cover candlestick patterns, trend analysis, and risk control using live charts.
- Institutes and academies that provide ongoing doubt-clearing support, webinars, and community discussion for real-time learning.
Exploring such courses helps you turn knowledge of the evening star candlestick pattern into a disciplined, rule-based trading approach rather than random experimentation.
Conclusion and Key Takeaways
The evening star pattern is a powerful yet simple bearish reversal signal that helps traders identify when an uptrend may be running out of steam. By reading its three-candle story and combining it with support–resistance and indicators, even everyday investors can make more informed decisions about when to book profits or stay cautious.
For those who wish to go beyond basic understanding, learning through the best stock market course in India can transform candlestick patterns from mere chart shapes into a complete, risk-aware trading strategy.
FAQs About Evening Star Pattern
1. What is an evening star candlestick pattern?
An evening star candlestick pattern is a three-candle bearish reversal formation appearing after an uptrend, consisting of a strong bullish candle, a small-bodied star, and a strong bearish candle closing into the first candle’s body.
2. How reliable is the evening star pattern for trading?
The evening star pattern can be quite reliable when it forms after a clear uptrend, near resistance, and is confirmed by strong volume or indicators, but it is never 100% foolproof and should be used with risk management.
3. Which timeframe is best for using the evening star pattern?
Daily and weekly charts usually provide more reliable evening star signals because they reflect broader market participation, while intraday charts require extra caution due to higher noise and volatility.
4. Can beginners use the evening star pattern successfully?
Yes, beginners can use the evening star pattern by first practicing on demo accounts, studying historical examples, and following simple, rule-based strategies with proper stop-loss placement.
5. How can the best stock market course in India help me understand this pattern better?
The best stock market course in India typically offers structured lessons on candlestick patterns, live chart practice, and expert guidance, helping you use evening star signals more confidently and safely in real trading.evening star pattern


Leave a Reply