

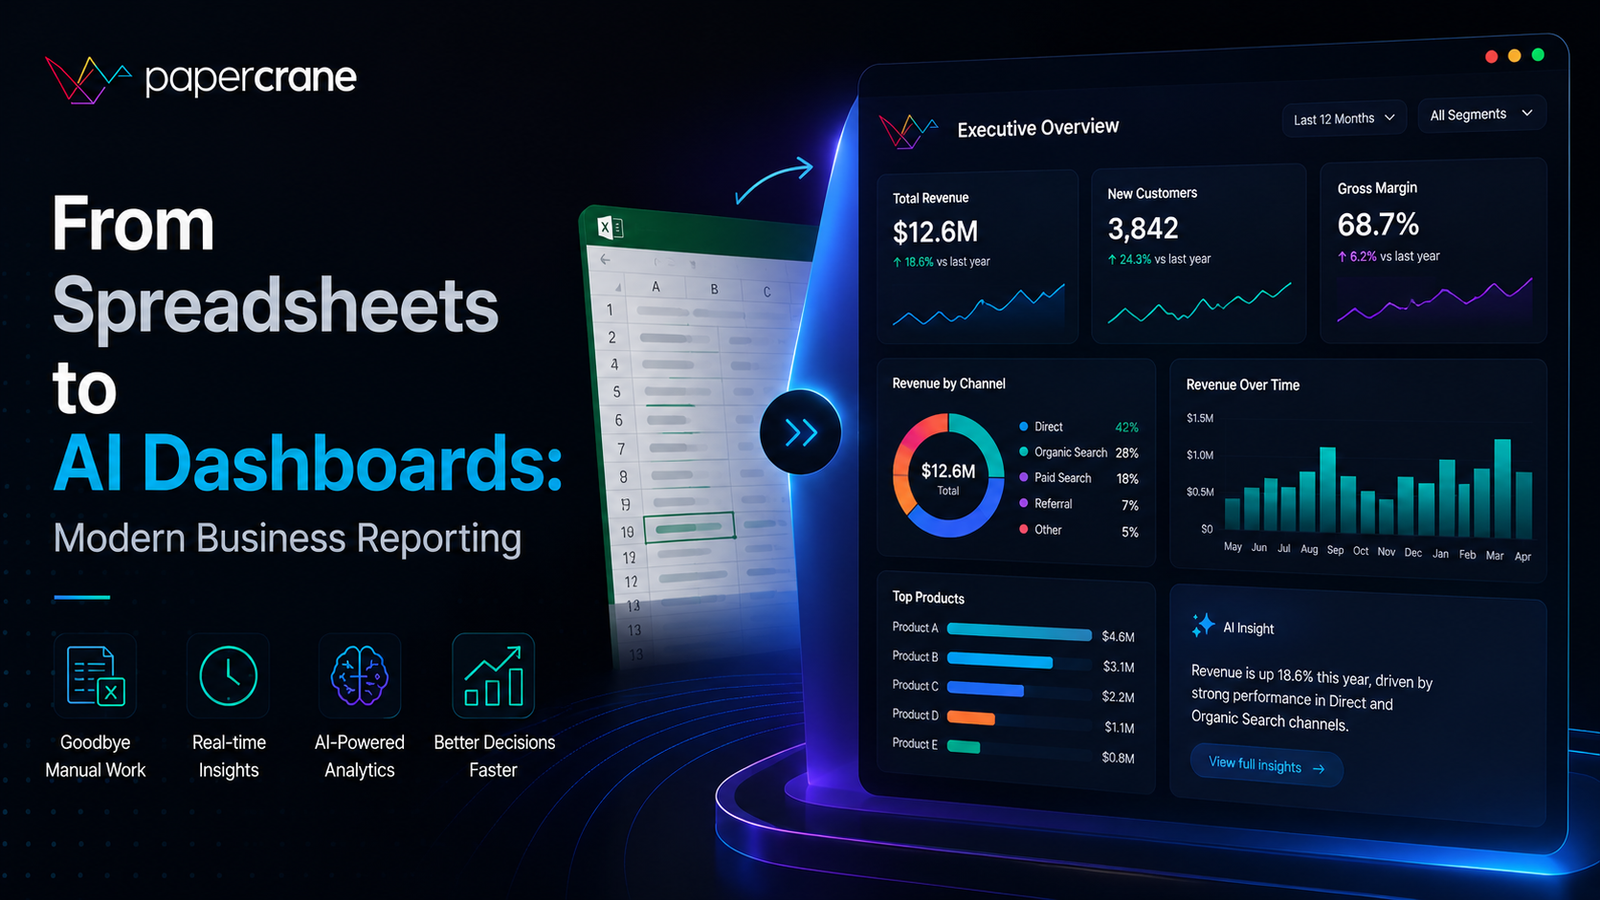
Most companies still run at least part of their reporting through a spreadsheet that someone quietly maintains, manually updates every week, and hopes nobody breaks by adding a stray column. It works, until it doesn’t, and by the time it breaks, it’s usually load-bearing for a decision someone upstream is waiting on.
This isn’t really a story about spreadsheets being a bad tool. They earned their place for good reasons and still serve plenty of purposes well. It’s a story about what happens when a tool built for quick, one-off calculations quietly becomes the backbone of recurring, high-stakes business reporting without anyone deciding that on purpose.
This piece looks at what actually changes when that reporting moves from spreadsheets to an AI-generated dashboard, and what to expect during the transition.
The Spreadsheet Era: What It Got Right
Spreadsheets earned their place for good reasons. They’re flexible, nearly everyone knows the basics, and they require no engineering approval to start using. For a small team tracking a handful of metrics, a well-built spreadsheet is genuinely hard to beat on simplicity.
The problems show up at scale. A spreadsheet that started as one person’s weekly export tends to accumulate manual steps: copy this data in, apply this filter, recalculate this formula, format this chart. Each step is small, but the whole process depends on one person remembering to do it correctly, every single time, without ever making a copy-paste error.
Where the Spreadsheet Model Breaks Down
Manual refresh cycles. Someone has to actually pull the data and update the sheet. If that person is out sick or leaves the company, the report stalls until someone else figures out the process, often by reverse-engineering formulas nobody documented.
Version confusion. “Q3_Revenue_FINAL_v3.xlsx” is a familiar joke because it’s a familiar problem. Multiple people editing copies of the same data leads to disagreements about which version is authoritative, usually discovered in a meeting rather than beforehand.
No audit trail. When a number looks wrong, tracing it back through several tabs of manual formulas is slow and error-prone, especially if the person who built the original logic has moved on.
Ceiling on complexity. Spreadsheets handle a few thousand rows fine. Once a business has enough transaction volume or customer data to genuinely need a warehouse, spreadsheet-based reporting starts silently truncating data or timing out, often without an obvious warning.
What an AI Dashboard Replaces, Step by Step
The transition doesn’t require ripping out your entire data process at once. It tends to happen in layers.
Layer one: the data connection. Instead of manually exporting a CSV from your database or SaaS tool, an AI dashboard connects directly to the live source, whether that’s a warehouse like BigQuery or Snowflake, or a tool like your CRM or payment processor.
Layer two: the query. Rather than a formula buried three tabs deep, the underlying logic is a visible, plain-English-generated query you can review directly. Asking “show me revenue by customer segment for the last six months” produces the chart without anyone writing the formula by hand.
Layer three: the refresh. Instead of someone remembering to update the sheet every Monday, the dashboard refreshes on a schedule or in real time, so the number on screen always reflects current data.
Layer four: the fix. When a data source changes structure, a spreadsheet breaks silently and stays broken until someone notices. An AI dashboard can route that error back to the same agent that built it, which attempts to reconcile the change automatically.
A Realistic Migration Path
Teams that make this switch smoothly tend to follow a similar pattern rather than converting everything overnight.
- Pick one recurring report first. Something painful and frequent, like a weekly revenue summary or a monthly churn report, makes a good test case because the comparison against the old spreadsheet is easy to judge.
- Run both versions in parallel briefly. Keep the spreadsheet running for a cycle or two while validating the new dashboard against it, so any discrepancy gets caught before the spreadsheet is retired.
- Retire the spreadsheet only once trust is established. There’s no need to force this on day one. Confidence comes from watching the numbers match consistently across a few reporting cycles.
- Expand to the next report once the first one sticks. A plain-English dashboard builder makes this expansion fast, since the setup cost for each additional report is a fraction of what building it from scratch in a spreadsheet required.
What Doesn’t Change
Moving away from spreadsheets doesn’t remove the need for someone to decide what a metric actually means. If “active customer” was ambiguous in the spreadsheet era, it’s still ambiguous now, and an AI dashboard will apply whatever definition it’s given rather than resolving the disagreement for you. That decision still belongs to a person, made once, and then applied consistently going forward.
Financial reporting that feeds external filings or investor updates also still benefits from a human sign-off, regardless of how the underlying number was generated. Automation changes how fast a number gets produced, not who’s accountable for its accuracy.
Trying This on a Single Report First
A low-risk way to evaluate this shift is picking your most frequently updated spreadsheet and registering to rebuild just that one reportagainst its live data source, so you can compare it directly to the hours currently spent maintaining the spreadsheet by hand.
Signs Your Spreadsheet Has Outgrown Itself
Not every spreadsheet needs replacing, and plenty of small, low-stakes trackers work perfectly well indefinitely. A few signals tend to indicate it’s genuinely time to move on:
- The person who built it is the only one who can fix it. If a broken formula requires waiting for one specific colleague to be back online, the report has become a single point of failure.
- Someone is manually copying data from more than two sources into it. Every manual copy step is a place where the wrong version or a stale export can quietly enter the report.
- The file is slow to open or frequently crashes. This is usually a sign the underlying data volume has outgrown what a spreadsheet was built to handle.
- People have stopped trusting the numbers. Once a team starts double checking a spreadsheet against other sources before believing it, the report has lost its core purpose.
If two or more of these sound familiar, that’s a reasonable signal to start testing a live alternative rather than patching the spreadsheet further.
Reporting That Keeps Up With the Business
The spreadsheet isn’t going away entirely, and it doesn’t need to. But for the recurring, high-stakes reports that a business actually depends on, a live AI dashboard removes the manual maintenance burden that made spreadsheets fragile in the first place, replacing “hope someone updates this correctly” with a system that updates and checks itself.













Leave a Reply